Top 10 FAQs About RSI, MACD, Bollinger Bands, and Moving Averages

  • Post author:
  • Reading time:4 mins read
  • Post last modified:December 22, 2024

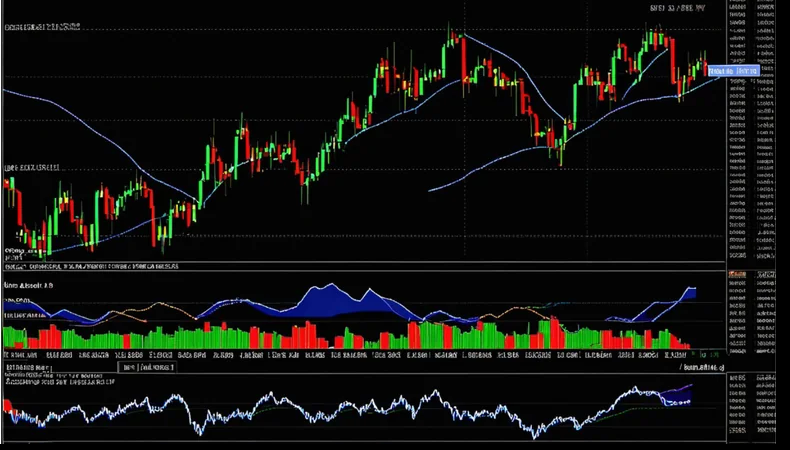
Top 10 FAQs About RSI, MACD, Bollinger Bands, and Moving Averages Technical indicators like RSI, MACD, Bollinger Bands, and Moving Averages are essential tools for traders and investors to analyze market trends, momentum, and potential price movements. They help interpret historical price data to identify buying and selling opportunities, manage risk, and improve decision-making. By understanding how these indicators work individually and in combination, traders can gain a more comprehensive view of market conditions, enhancing…

Continue ReadingTop 10 FAQs About RSI, MACD, Bollinger Bands, and Moving Averages

Bollinger Band and RSI Indicator.

  • Post author:
  • Reading time:4 mins read
  • Post last modified:December 18, 2024

If you are analyzing Bollinger Bands with a specific focus on ymax or (any other stock) (likely referring to the upper Bollinger Band, which represents the maximum range based on recent volatility), here are some observations and signals you can evaluate: 1. Overbought Signal What to Observe: When the stock price touches or exceeds the upper band (ymax), it might indicate that the stock is overbought and due for a potential pullback. Why it Matters:…

Continue ReadingBollinger Band and RSI Indicator.